Making Compiled Binaries Accessible to AI Coding Agents
2026-03-18
I build tools. That is what I enjoy most about security research: not just finding the bug, but building the system that finds the bug. So when AI coding agents started getting good at navigating source code, I wanted to know if I could make them do the same thing with compiled binaries.
The short answer: not without significant infrastructure. Agentic tools like Claude Code, Cursor, and Codex are effective at navigating source code repositories. Point them at a large C++ codebase or a complex CMake project, and they will read the code, understand the types, follow the includes, and refactor entire subsystems. They depend on the structural semantics of modern software projects.
But give that same agent a compiled binary and it cannot even extract the functions inside it, let alone reason about them. That capability lives inside software reverse engineering (SRE) frameworks like IDA Pro, Ghidra, or Binary Ninja. So the question became: how do you get the SRE’s analysis data into the agent’s hands? I decided to build an extraction and analysis pipeline to bridge that gap. I chose to build on top of IDA because I’ve always been a fan of it.
The First Experiment: The Raw C++ Problem
I started simple. I used a Python script via the IDAPython SDK to dump raw Hex-Rays decompiled C++ into a series of .cpp files, threw them into a folder, and let the agentic coding tool use its native semantic search to bring in the context.
For isolated functions or small groups of related functions (say, analyzing how a specific RPC method validates its input parameters or how a state machine handles transitions) it worked unsurprisingly well. Sometimes this required manually passing the target files to the model using @ mentions, but once the code was in context, the model could explain complex logic, rename variables to make them readable, and spot localized flaws.
The problem wasn’t the model’s ability to analyze complex code. The problem was that finding the right functions to read in the first place was slow and inefficient.
Then I tried multiple modules. I targeted the Windows LanmanServer service, a system service hosted by svchost.exe and implemented through its service DLL srvsvc.dll. I extracted all 43 DLLs loaded into the svchost.exe process. Each module got its own directory of decompiled C++ files plus JSON metadata. The model could now follow references between modules. When a function in srvsvc.dll called an API exported by netapi32.dll, and both modules were in the workspace, the model could read both sides. Cross-module reasoning was working.
But the static files could not scale. The model could sometimes find functions that call a specific dangerous API across 43 modules, but the process was slow and unreliable. It could attempt to trace a call chain five levels deep across three DLLs, but it would frequently get lost or miss connections along the way. Classifying every function in a module by purpose, or filtering down to only those reachable from an RPC method entry point, requires structured queries over cross-reference data, not file reads.
My goal was to completely automate code and callgraph analysis, minimizing the human in the loop for data collection and digestion. The idea was simple: let the machine do the heavy reverse engineering work of digesting function internals. Let it figure out the function’s purpose, the internal logic, exactly what input gets processed, and the overall structural context. Once the machine presents this information in a summarized way, I could use my actual vulnerability research time to reason on the findings and decide which exploitation path to chase.
The fundamental issue behind all of this inefficiency was the irregular layout of decompiled C++.
In a real, compilable codebase, agentic tools rely heavily on advanced code navigation and indexing. Cursor, for example, uses Language Server Protocols (LSPs) and embeddings to search semantically through the code, while Claude Code appears to rely on Tree-sitter parsing see references in Changelog to map out execution flow and resolve references.
However, decompiled C++ completely breaks these mechanisms. It consists of isolated function definitions grouped arbitrarily by the extraction script into flat .cpp files. There are no project files, no #include headers linking the files together, and no shared type definitions to build an Abstract Syntax Tree (AST) from. A function in file_A.cpp might call a function in file_B.cpp, but without explicit structural connections, it fails to naturally capture the relational context. The agent’s native code-navigation tools fail to resolve the definition. It falls back to semantic text search, which works well on real source code but cannot reliably traverse a callgraph built from disconnected decompiler output.
I initially tried to fix this by augmenting the workspace with massive JSON files containing the binary metadata and cross-references (Xrefs). But that wasn’t enough either. The agent would frequently fail to consume or correctly correlate the information buried inside static JSON dumps.
Until I realized something: agentic tools excel at using tools. Providing a deterministic tool that explicitly fetches the exact code and cross-references for a specific function is far better than hoping semantic search stumbles upon it. If I wanted these agents to be better vulnerability researchers, I couldn’t just feed them flat, disconnected source code and static JSON. I had to give them queryable, structured data and the tools to retrieve it.
Moving to Structured Output: DeepExtractIDA
My focus shifted from extracting just code to extracting structured context directly from the disassembler alongside the code. To achieve this, I built DeepExtract, an open source IDA plugin.
DeepExtractIDA interfaces with the IDAPython SDK (targeting the IDA Pro 9.x API) and the Hex-Rays decompiler to run a deterministic three-stage extraction pipeline:
- Binary Loading: The pipeline begins with IDA Pro loading the PE file. It performs its standard auto-analysis passes, builds its internal database, and applies any available signatures.
- Extraction: The plugin iterates over every single function recognized in the database. It extracts the full structural context: the raw disassembly, the Hex-Rays decompiled C/C++ code, inbound and outbound cross-references, stack frame metrics, string literals, and dangerous API calls. It goes beyond the functions to pull file-level PE headers, import directories, export directories, section definitions, and security features.
- Output: All of this data is written into highly structured, schema-enforced, per-binary SQLite databases, ensuring that every relationship is preserved.
Extraction at Scale
DeepExtract operates in two primary modes. The first is an interactive mode running directly within the IDA GUI as a standard plugin (install with hcli plugin install DeepExtract). This mode is designed for targeted analysis of a single binary, capturing the researcher’s current session state (including renamed variables, custom comments, and manual type definitions) and exporting it cleanly.
But to move beyond interactive, single-module GUI extraction and into wide vulnerability research, I built a headless batch extractor script. It runs IDA autonomously from the command line, allowing you to process massive ecosystems of binaries automatically, downloading PDB symbols via symchk on the fly. For this extraction mode, clone the repository and run the script directly.
The headless extractor operates in three core modes:
- PID Mode: You provide a Process ID, and the extractor enumerates every module loaded into the target’s memory space and extracts them all. Running this against
svchost.exehosting the LanmanServer service extracted context for 43 DLLs. Running it againstcmd.exeextracted context for 57 modules. One operation captures the complete execution logic of a process. - Directory Mode: You provide a directory path and it recursively extracts every PE file it finds, launching parallel IDA instances. At full scale, you can point it at
System32,SystemApps,Program Files\Common Files,ImmersiveControlPanel,IME, and the rest of the Windows directory tree to extract and decompile the entire Windows codebase: DLLs, executables, and kernel drivers (.sysfiles are PE binaries and get extracted the same way). - Whitelist Mode: You provide a targeted text file containing a specific list of modules to extract. You can simply list the required paths in a text file and let the headless engine process them safely.
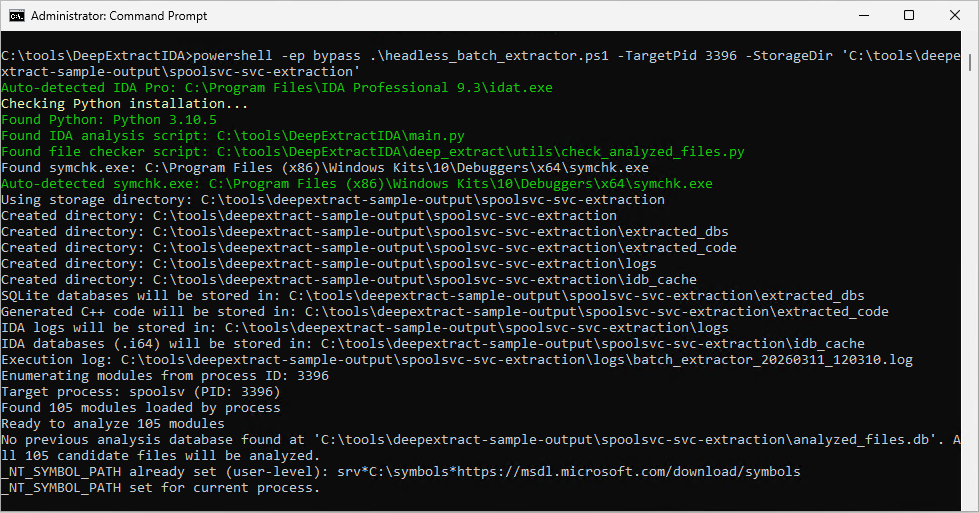
Here is what extracting a running process looks like in practice. You need IDA Pro 9.x installed and the Windows SDK Debugging Tools for automatic PDB symbol downloading (symchk.exe). The script auto-detects both. See the DeepExtractIDA README for full setup details.
git clone https://github.com/marcosd4h/DeepExtractIDA.git
cd DeepExtractIDA

# Extract all modules loaded by a running process
.\headless_batch_extractor.ps1 -TargetPid 1234 -StorageDir "C:\vrfun\storagedir"
The script enumerates every DLL loaded in the target process, downloads PDB symbols from Microsoft’s public symbol server, launches parallel IDA instances, and writes the full extraction output to StorageDir. Once complete, open that directory in Cursor or Claude Code and type “install runtime” to set up the analysis environment.
The Data Architecture
The extraction pipeline produces a highly structured dataset. For every module analyzed, the extractor generates a SQLite database adhering to a rigorous relational schema:
file_info: Contains binary-level metadata: cryptographic hashes, import/export tables, entry points, security mitigation flags (ASLR, DEP, CFG, SafeSEH), Rich header, TLS callbacks, and PDB paths.functions: Holds the per-function analysis data: decompiled code, raw assembly, inbound/outbound cross-references, dangerous API calls, string literals, global variable accesses, vtable contexts, loop analysis metrics, and stack frame parameters.function_xrefs: Maps every call edge (caller ID to callee ID) as a deduplicated relational table with cross-module resolution and function type classification (generic, library, API, vtable), enabling SQL-based callgraph queries that replace text-based search entirely.
Alongside the databases, the plugin still generates C++ source files. But they are no longer flat, unstructured dumps. Functions are grouped by class and namespace into files capped at roughly 450-500 lines, sized to fit within an LLM’s context window without truncation.
Here is the full output layout the batch extractor produces. The AGENTS.md and CLAUDE.md files at the top level contain instructions for installing the DeepExtract analysis runtime (more on what that is shortly). When you open this directory in Cursor or Claude Code, those are the first files the agent reads. The full database schema and data format reference documents every table, column, and JSON field. Format references for the JSON metadata: module_profile.json, function_index.json, file_info.json.
<StorageDir>/
├── AGENTS.md                      # AI agent runtime bootstrap (Cursor/Codex)
├── CLAUDE.md                      # AI agent runtime bootstrap (Claude Code)
├── analyzed_modules_list.txt      # List of files analyzed (all modes)
├── extraction_report.json         # Summary report with success/failure stats
├── analyzed_files.db              # Master tracking database
├── extracted_dbs/
│   └── <filename>_<hash>.db       # Individual analysis databases (one per file)
├── extracted_code/
│   └── <module_name>/             # Per-module output directory
│      ├── *.cpp                   # Generated C++ code (unless -NoGenerateCpp)
│      ├── function_index.json     # Function-to-file lookup index
│      ├── module_profile.json     # Pre-computed module fingerprint
│      ├── file_info.json          # Structured analysis metadata
│      └── file_info.md            # Human-readable analysis report
├── logs/
│   ├── batch_extractor_<timestamp>.log       # PowerShell batch execution log
│   ├── <filename>_<hash>_<timestamp>.log     # IDA analysis logs
│   ├── symchk_<filename>_<timestamp>.log     # Symbol download logs (if enabled)
│   └── symchk_<filename>_<timestamp>.log.err # Symbol download error logs (if enabled)
└── idb_cache/
    └── <filename>_<hash>.i64      # IDA database files
But now I had a new problem: I had hundreds of structured SQLite databases and JSON files sitting on my hard drive. How do I actually get the agent to use them?
The Journey to the Runtime
My first attempt to bridge the data to the AI was to build an external orchestration layer. I spent weeks messing around in the “Langchain” phase.
I tried to process this massive SQLite/JSON dataset using traditional AI frameworks. I explored Langchain, the LangChain Deep Agents SDK, and complex multi-agent frameworks like CrewAI. I wrote a few PoC Python scripts that attempted to manage ReAct loops, querying the SQLite database and feeding the context back to the LLM.
It was a disaster. These heavy orchestration frameworks felt rigid, brittle, and inflexible for the highly interactive, ad-hoc nature of vulnerability research. They were not interactive at all. I would submit a query, wait three minutes for the CrewAI agents to debate among themselves, and get a result.
It completely broke the flow. A vulnerability researcher relies on a tight interactive feedback loop: spot a suspicious pattern, trace xrefs to check reachability from an attack surface like an RPC endpoint, read the caller’s input validation, look for security checks, and decide whether to chase the path or pivot to the next candidate. Those frameworks stripped away my ability to stay in that loop.
Agentic coding tools (like Cursor and Claude Code) are better suited for this exact reason. They provide a tight, chat-based interface directly over your files, allowing for immediate, conversational iteration.
The Breakthrough
I was fighting the tools instead of leveraging them. I already knew agents excel at using tools. That is what they are built to do: reason about the task, pick a tool, execute it, observe the result, repeat. I didn’t need to build a massive external orchestration application. I could extend the native AI IDE agents directly.
Cursor and Claude Code provide multiple mechanisms to give the agent new tools without writing a single line of framework code:
- Rules (Cursor, Claude Code): Markdown files (
AGENTS.md,.cursor/rules/,CLAUDE.md,.claude/rules/) that inject persistent instructions into the agent’s context. They tell the agent how to approach a domain, what conventions to follow, and what tools are available. These load automatically when the agent starts a session. - Skills (Cursor, Claude Code): Portable, reusable packages that teach the agent specialized workflows. A skill is a
SKILL.mdfile paired with optional scripts. The agent reads the markdown instructions, then executes the bundled scripts through its shell tool. Skills can be invoked explicitly via/skill-nameor applied automatically when the agent determines they are relevant. - Commands (Cursor, Claude Code): Slash commands that trigger structured, multi-step workflows. Type
/triageor/ai-memory-corruption-scanand the agent follows a predefined methodology, calling the right skills in the right order. - Subagents (Cursor, Claude Code): Specialized AI personas defined in markdown that run in isolated context windows. The parent agent delegates tasks to them, keeping its own context clean. Each subagent can have its own system prompt, model, and tool access.
These mechanisms are converging into an open standard. The AGENTS.md format is being adopted across coding agents (Cursor, Codex, Gemini CLI, and others) as a common way to give agents project-level instructions. The .agents/ directory convention extends this to skills and subagents.
This changed everything for me. Commands, Agents, and Skills do not need to be complex Python classes wired together in a Langchain graph. They are markdown files that instruct the agent, paired with lightweight Python scripts that the agent executes through its native shell tool.
So, I built the DeepExtract Agent Analysis Runtime.
When you open your extraction directory in your agentic coding tool, you simply type “install runtime”. The IDE reads the AGENTS.md file, which tells it to execute a local shell command to git clone the runtime repository into a hidden .agent folder and configure the local environment automatically.
The agent is no longer limited to reading irregular C++ files, it is equipped with a specialized vulnerability research toolkit that it can invoke natively via its shell tools.
The DeepExtract Runtime Concept
The runtime is not an external service or a separate orchestration application. It installs as an .agent/ directory inside the extraction output and extends the coding agent directly. The agent gains vulnerability research capabilities without leaving the conversation.
The core design goal is encoding VR domain expertise once. Instead of re-explaining reverse engineering methodology in every conversation, or forcing the agent to guess how to query structured analysis databases for tasks like extracting a function’s decompiled code or tracing who calls a given export, the runtime encodes that knowledge into skills, commands, and agent personas that the agent loads on demand and applies consistently across sessions.
The other design challenge is context management. Give an LLM access to large volumes of binary analysis data and its reasoning degrades, context rot sets in. The runtime addresses this through a strict, five-layer architecture combined with deliberate handoff patterns: data flows upward through the layers, but large payloads never live in the agent’s context. They stay on disk. The agent only sees compact summaries and structured results, loading full data on demand when it needs to go deeper.
An important note on the runtime: this is still experimental. Some parts work well, like callgraph tracing, function data gathering, and attack surface mapping. Others are still under active development. One fun thing about this architecture is that VR workflows are defined through markdown and Python scripts, which makes it easy to experiment fast: try a new scanning approach, see if it produces useful results, and keep what worked. For example, my initial approach to vulnerability scanning was heavily heuristic-driven. It worked, but it was a bit too naive and harder to generalize across different bug classes. I then started exploring fully AI-driven scan approaches after I read through Theori’s RoboDuck CRS. Their LLM-first approach to bug finding, vulnerability scoring, and agent-based filtering convinced me to push toward a fully AI-driven scan pipeline. I started reworking the scanner architecture to let the LLM drive the analysis end-to-end: building its own threat models, selecting its own scan targets, and forming adversarial hypotheses without rigid heuristic scaffolding. That work is ongoing, and I will cover it in a later post.
Both the extraction plugin and the DeepExtract analysis runtime are open source. The SQLite databases are portable, any tool that reads SQLite can consume them, and the runtime’s skill scripts are plain Python, so any agent framework that can execute shell commands can use them. The runtime currently targets Cursor and Claude Code as the primary agentic coding tool, Codex support in progress.
Here is what the .agent/ directory contains:
.agent/
├── AGENTS.md              # Root agent instructions (loaded by Cursor/Claude Code)
├── hooks.json             # Lifecycle hook configuration for Cursor
├── settings.json          # Runtime settings
├── agents/                # Specialized sub-agents (re-analyst, security-auditor, ...)
├── bootstrap/             # Installation and update scripts
├── commands/              # Slash commands (/triage, /audit, /scan, /explain, ...)
├── config/                # Runtime configuration and pipeline definitions
├── docs/                  # Architecture docs, authoring guides, format references
├── helpers/               # Shared Python library (DB access, function resolution, API taxonomy, caching, reporting, etc)
├── hooks/                 # Lifecycle hooks (sessionStart, stop)
├── rules/                 # Workspace conventions and output contracts
├── skills/                # Analysis skills with Python scripts (callgraph-tracer, map-attack-surface, ...)
└── tests/                 # Unit and integration tests
1. Commands (The Workflows)
Commands are user-facing slash commands defined entirely in Markdown (e.g., /triage, /scan, /audit). They act as the high-level orchestrators. When you type /triage, you are invoking a specific Markdown file that feeds the AI a step-by-step methodology for analyzing a binary, instructing it on which skills to call in what order. Commands can also delegate to specialized sub-agents when the analysis requires deeper, context-heavy reasoning that would overwhelm the main conversation.
2. Agents (The Personas)
Agents are specialized LLM sub-agents launched via the IDE’s native subagent or Task tool. For instance, there is a re-analyst sub-agent for explaining code, and a security-auditor sub-agent that acts as a strict skeptic of security findings. Each sub-agent runs in its own isolated context window. This is critical because decompiled C++ output is large, dumping thousands of lines of function bodies into the main orchestrator’s context causes context rot, degrading the quality of its reasoning as the window fills with noise. Sub-agents absorb that cost and return only their conclusions.
3. Skills
Skills provide programmatic access to the IDA data via lightweight Python scripts. Each runtime skill is a SKILL.md file paired with a Python script. The SKILL.md tells the agent what the skill does and when to use it. The Python script does the actual work: querying the SQLite databases, parsing decompiled code, traversing callgraphs, computing metrics, or scanning for vulnerability patterns.
When a skill runs as part of a multi-step workflow, it writes full results to a workspace directory on disk and only returns a compact summary to the agent. This filesystem handoff pattern is how the runtime prevents context rot across complex analysis pipelines. The agent coordinates using summaries and file paths, not by holding unnecessary data in its context window.
The agent does not guess what a function does or attempt to search for callers through text. It invokes a skill. To trace a callgraph, it runs callgraph-tracer. To find reachable entry points, it runs map-attack-surface. To classify a function, it runs classify-function. The data flow is always the same: the agent calls the script via its shell tool, the script queries the database, and the agent reasons on the structured result.
4. Helpers & Hooks (The Infrastructure)
The Helpers layer consists of shared Python APIs for read-only database access, function resolution, workspace handoff, JSON output formatting, and caching. Every skill imports from the same library, so no script is reimplementing SQLite queries or inventing its own output format.
One helper capability worth calling out: library noise filtering. A typical Windows DLL contains 30 to 60 percent library boilerplate: C++ runtime support, Windows Implementation Library (WIL) helpers, Windows Runtime (WRL) template instantiations, STL internals, and ETW tracing stubs. Without filtering, the agent wastes its context window on code that is identical across every Microsoft binary. The helpers automatically tag these functions using the function_index.json library classification, so every skill, agent, and command can filter them out by default and focus on the application-specific logic that actually matters for analysis.
Hooks handle lifecycle automation. The sessionStart hook runs before you type a word: it scans the extraction databases, reads skill metadata, and injects a compact module context table into the agent’s session using progressive disclosure (only summaries and frontmatter at first, full skill instructions load only when the agent activates a skill). The stop hook enables batch processing through a grind loop protocol. If the agent is auditing 50 functions, it tracks progress in a Markdown scratchpad. When its turn ends, the stop hook checks the scratchpad for unchecked items. If work remains, it re-invokes the agent automatically, up to a configurable iteration limit.
5. Data (The Ground Truth)
At the very bottom lies the read-only SQLite DBs, JSON tracking metadata, and .cpp files generated by DeepExtractIDA.
Wrap Up
The structural knowledge gap is closed. The agent has the same cross-references, PE metadata, and control flow data that a researcher would navigate manually in IDA. There is a way to run agentic VR workflows against structured binary intelligence.
With the runtime installed, the analyst can direct the agent to:
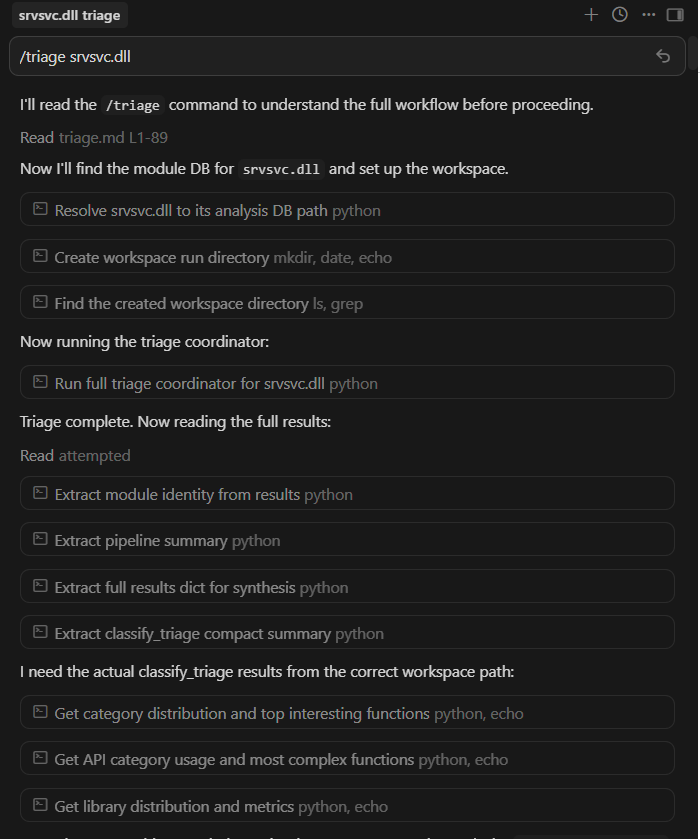
- Triage any module: classify every function, discover entry points, rank the attack surface by reachability
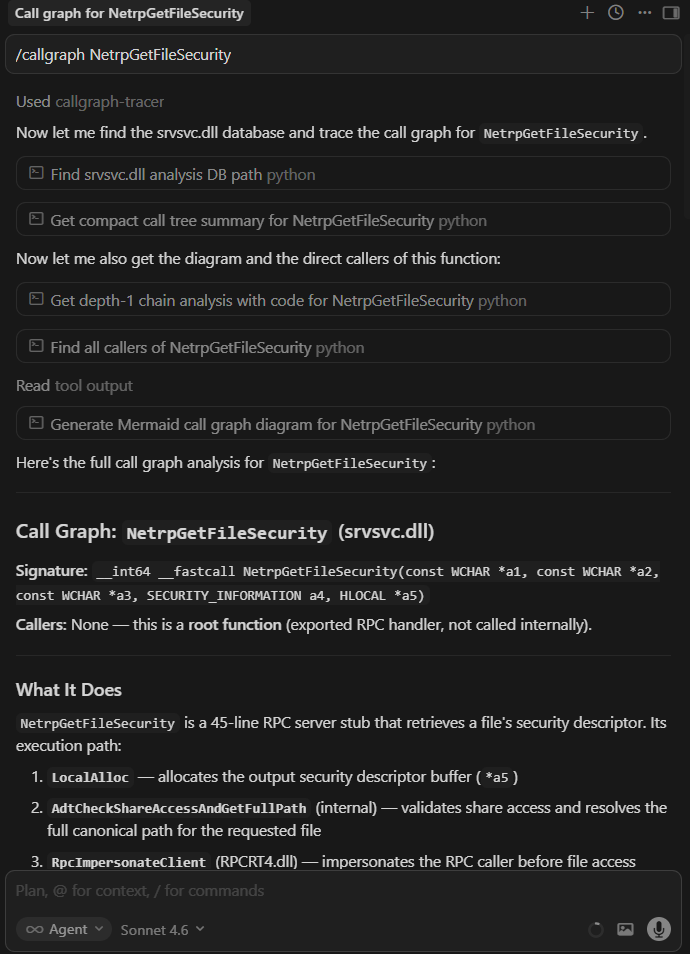
- Traverse call graphs forward or backward across module boundaries, and verify reachability from attack surface entry points
- Run AI vulnerability scans with adversarial prompting and independent skeptic verification
- Analyze IPC interfaces: enumerate RPC procedures, COM servers, and WinRT activation servers, audit privilege boundaries
- Reconstruct C++ types from memory access patterns and lift decompiled functions into clean, readable C++
In practice, this looks like:
/triage srvsvc.dll
/hunt-plan srvsvc.dll
/taint srvsvc.dll NetrpGetFileSecurity
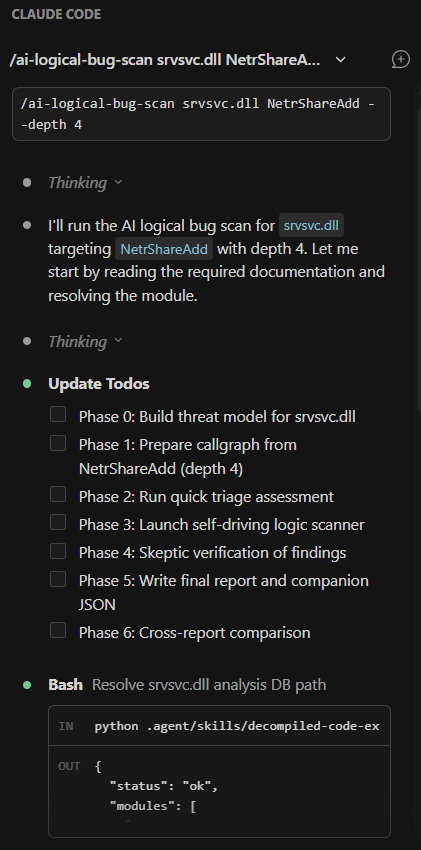
/ai-logical-bug-scan srvsvc.dll NetrShareAdd --depth 4
/memory-scan srvsvc.dll NetrShareGetInfo
Triage a module, plan a hypothesis-driven vulnerability research campaign, trace attacker-controlled data through a high-risk RPC handler, run an AI-driven logic vulnerability scan four levels deep into a call chain, scan an RPC procedure for memory corruption. Each command triggers a structured workflow that calls the right skills, queries the right databases, and returns results the researcher can reason on.
This is all still early and experimental. But the direction feels right: give the agent the same data the researcher would use, give it deterministic tools to query that data, and let it do the mechanical work so you can focus on the interesting part.
This post ended up longer than I intended, so I will save the live demonstration for the next one: a documented reverse engineering session showing the full workflow from extraction to analysis against a real Windows service. I will keep building, keep breaking things, and keep writing about what I find.
Reference: Extraction and Analysis Capabilities
The following table covers what DeepExtractIDA extracts from the binary: the raw structured data that feeds every runtime operation.
| Feature Category | Extracted Data Points | Why it Matters for VR |
|---|---|---|
| Identification | MD5, SHA256, file size, extension. | Establishes ground truth for the binary, ensuring hashes match target environments. |
| Version Information | Product name, company name, copyright, original filename, PDB path. | PDB paths reveal build environments and internal project structure. Original filenames help correlate renamed or relocated binaries. |
| PE Headers | Sections, entry points, Rich header (linker toolchain data), TLS callbacks. | Exposes hidden execution triggers (TLS callbacks execute before main()) and linker toolchain fingerprints via the Rich header. |
| Security Posture | ASLR, DEP/NX, CFG, SafeSEH status, DLL characteristics. | Determines whether a memory corruption bug is actually exploitable or if mitigations block the attack path. |
| Dependencies | Full imports, exports, forwarded exports, delay-load DLL imports. | Required for mapping cross-module callgraphs and identifying the binary’s external attack surface. |
| Runtime Environment | .NET assembly detection, CLR metadata. | Identifies managed code binaries that require different analysis strategies than native PE files. |
| Function Signatures | Base and extended signatures, demangled and mangled names. | Provides type context to the LLM, enabling it to reason about integer sizes, pointer types, and calling conventions. |
| Code Extraction | Full disassembly and Hex-Rays decompiled C/C++ output. | The core of the analysis. The LLM reads decompiled code for logic and cross-checks against assembly to detect decompiler artifacts. |
| Cross-References | Inbound and outbound xrefs in full and simplified formats, plus a deduplicated relational table (function_xrefs) with cross-module resolution and function type classification. |
Drives the callgraph-tracer. Enables SQL-based callgraph queries that resolve execution paths across module boundaries. |
| API Intelligence | Matches outbound calls against 480+ security-critical APIs (e.g., CreateRemoteThread, LoadLibrary, CreateProcessW). |
Flags functions that call dangerous sinks, narrowing the search space for security-relevant code. |
| String Literals | Per-function string references. | Reveals error messages, format strings, registry keys, and protocol identifiers that expose function purpose and potential format string bugs. |
| Global Variable Accesses | Read/write references to global data per function. | Essential for tracing state machines and identifying TOCTOU vulnerabilities on shared global state. |
| Stack Frame Analysis | Aggregate frame sizes (locals, arguments, saved registers), frame pointer and exception handler flags, stack canary detection via multi-heuristic analysis (variable names, security cookie calls, XOR patterns). | Determines whether a buffer overflow can overwrite a return address or if a canary protects it. Heuristic canary detection catches non-standard implementations. |
| Control Flow | Natural loop detection via dominator-based back edges with SCC fallback for irreducible control flow, per-loop cyclomatic complexity, infinite loop heuristic (zero exit edges). | Directs the agent toward complex, error-prone logic and potential Denial-of-Service loops. |
| VTable Analysis | Experimental. Virtual call resolution for [reg+offset] patterns, vtable slot inspection, per-class method grouping from demangled names. |
Reconstructs C++ classes and COM interfaces, resolving object-oriented dispatch paths that are opaque to standard static analysis. |
| Indirect Call Resolution | Experimental. Backward pattern matching for register loads, memory dereferences, function pointer arrays. Jump table detection via IDA’s switch analysis with manual fallback. Basic obfuscation handling (XOR/ADD/SUB transforms). | Resolves indirect calls and jump tables that would otherwise appear as dead ends in the callgraph. |
This table covers what DeepExtractRuntime builds on top of that extracted data: the analysis capabilities the agent uses to perform vulnerability research.
| Category | Capabilities |
|---|---|
| Module Triage | Function classification across 17 categories, entry point discovery, attack surface ranking by reachability. |
| Call Graph Analysis | Forward/backward traversal, cross-module resolution, topology analysis, path queries, diagram generation. |
| IPC Analysis | RPC procedure enumeration, COM server mapping, WinRT activation server analysis, privilege boundary auditing. |
| AI Vulnerability Scanning | Memory corruption, logic vulnerability, and taint analysis scanners with independent skeptic verification. |
| Security Auditing | Per-function security dossiers, attack reachability verification, dangerous API mapping. |
| Code Lifting | Batch lifting of decompiled functions into clean C++ with shared struct definitions and dependency ordering. |
| Type Reconstruction | Struct/class inference from memory access patterns, vtable reconstruction, compilable header generation. |
| PE Analysis | Import/export resolution across modules, dependency graphs, forwarder chain resolution. |
| Batch Processing | YAML pipeline definitions, headless execution across multiple modules, cross-module result comparison. |
| Finding Management | Finding persistence, cross-report comparison, cross-module prioritization. |